A telegram nobody throws away
An airport’s weather station issues a METAR every half hour or hour, and it reads like a telegram: ‘+TSRA’ is a heavy thunderstorm with rain, ‘-SN BR OVC008’ light snow, mist and overcast at eight hundred feet. Pilots read it before every approach. Most flight trackers show the latest one and forget it the moment the next arrives.
We keep them. Every report from every airport that publishes one, since 11 August, and nothing gets deleted. By 5 October that was 11.7 million reports from 5,748 weather stations, and on that single day 5,589 of them reported. On top of that come forecasts, more than half a million of them from 3,209 airports.
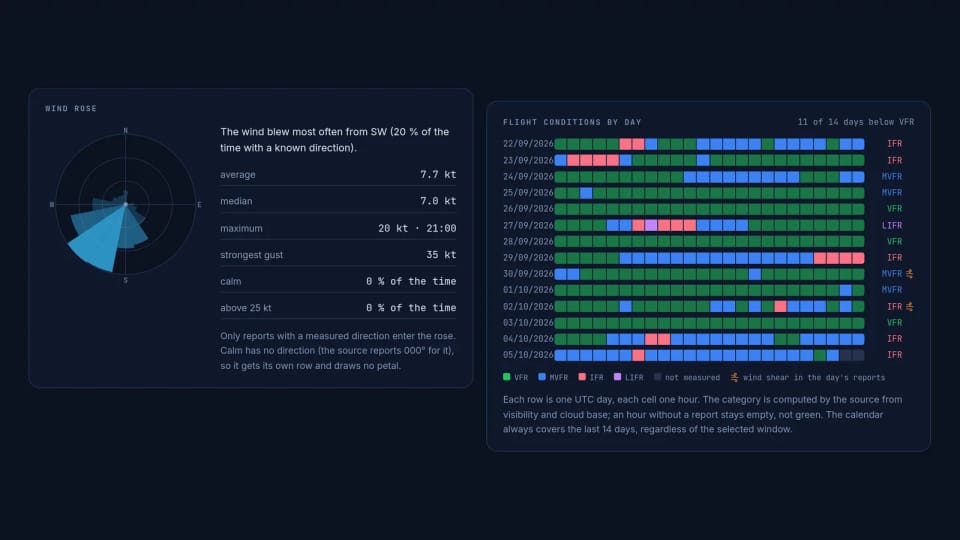
That’s what an airport’s weather page is built from. It starts with the present: temperature, the sky in a sentence, and whether pilots are flying by sight or by instruments right now. Then it looks back, a day, a week, fourteen days or a month. Temperature and dew point as a curve that breaks off where a report is missing instead of drawing a line through the gap. A wind rose showing where the wind blew from most often and how hard. And a calendar where every cell is one hour, coloured by flight conditions, from green for clear weather to purple for fog you can barely see the runway through. An hour with no report stays empty. It doesn’t turn green.
Next to each day sits the share of delayed departures from the same day, with a plain sentence that a link isn’t a cause. Sometimes fog and delays line up perfectly, sometimes the worst day of the month was perfectly on time. For the worst day in the window there is a button that opens the map and plays back the traffic as it was. And whoever wants the raw material can download every report in the window as a table.
Clouds that are really there
Clouds drift over the 3D airport, and not just any clouds: the ones that are really above it. The report says how much of the sky is covered and how high the cloud base sits, so ‘SCT035’ becomes scattered cloud with its base 3,500 feet above the airport. Where the station can’t see, around the airport and higher up, the GFS forecast model fills in where the cloud thickens and where it clears, and whether there is cirrus above it all. A clear sky in the report the model never overrules.
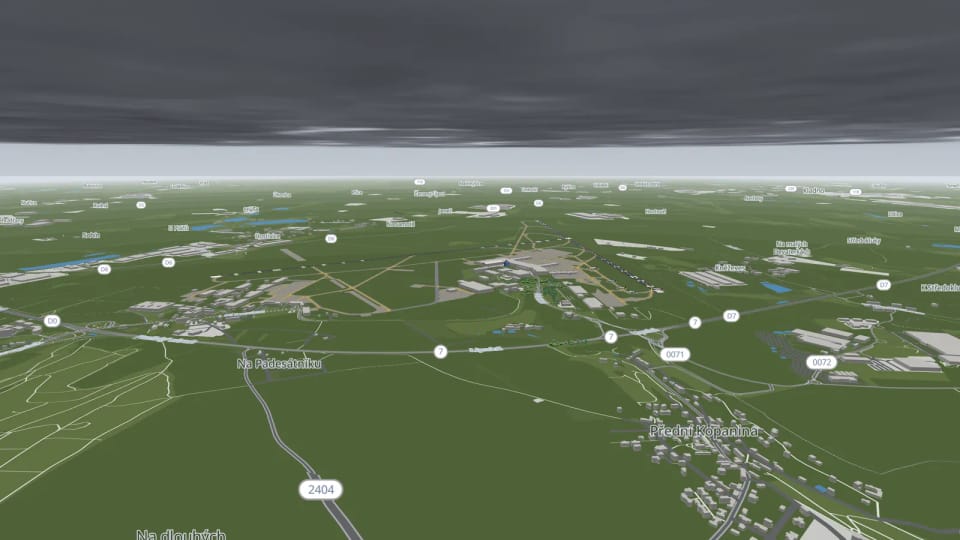
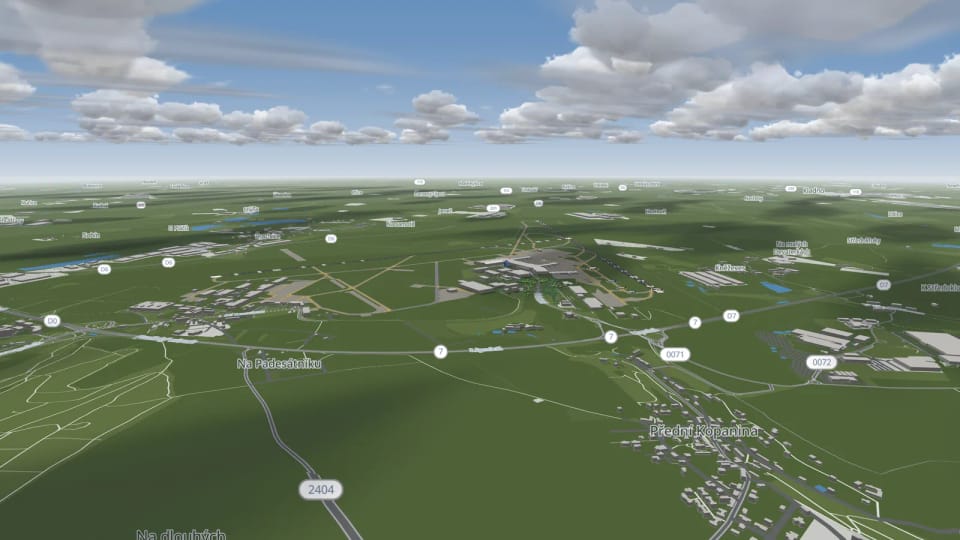
Each kind is drawn differently. Cumulus with a flat bottom exactly at the base and a cauliflower top, a low grey sheet of stratus under an overcast, small puffs and greyish sheets in the middle layer, thin fibres of cirrus high up. How much of the sky is covered decides the rest: a few lone clouds, groups and rows with blue gaps, a field with holes, or a continuous layer. When the report mentions towering or thunderstorm clouds, they grow tall and turn darker.
The light comes from the real sun over the airport. White tops and shaded bottoms by day, orange and pink at sunset, and the high cirrus keeps glowing after the low clouds have gone grey, because the sun still reaches it. The wind lines the clouds up in rows downwind and their shadows run across the airport.
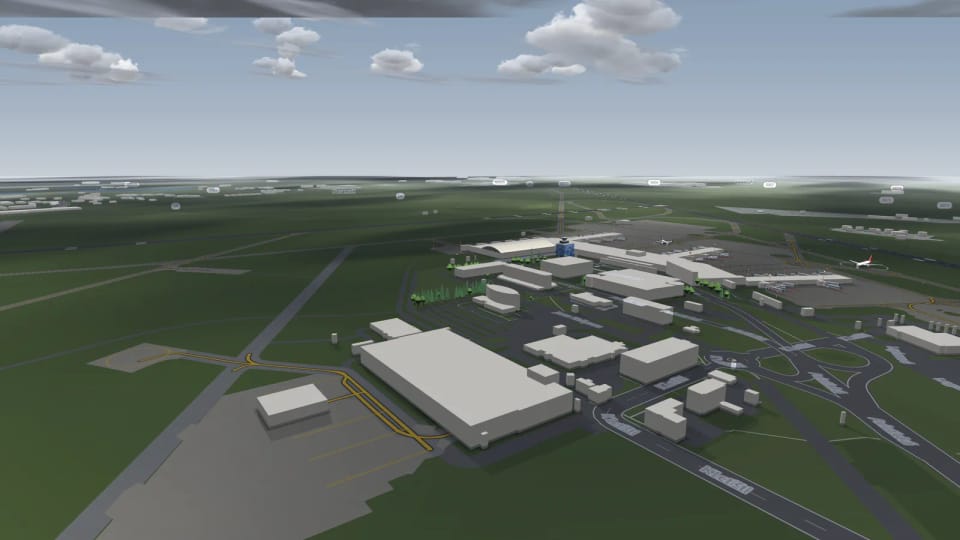
To see them you need the sky, so the camera can now be tilted almost to the horizon. At the steepest angle about a third of the picture is sky, with the airport still below. And the clouds must never hide what you came to see. An aircraft is always drawn whole, even inside a cloud. Look down on a low overcast and it opens up around the spot you’re looking at, so the airport stays visible while the layer carries on into the distance. A cumulus that would sit between the camera and the airport melts away. On the slowest devices there are no clouds at all, so the scene never stutters. And one honest sentence that the scene itself says too: the height, the cover, the kind and the light match the report, but the shape of each particular cloud is an illustration.
Rain, snow and wet tarmac
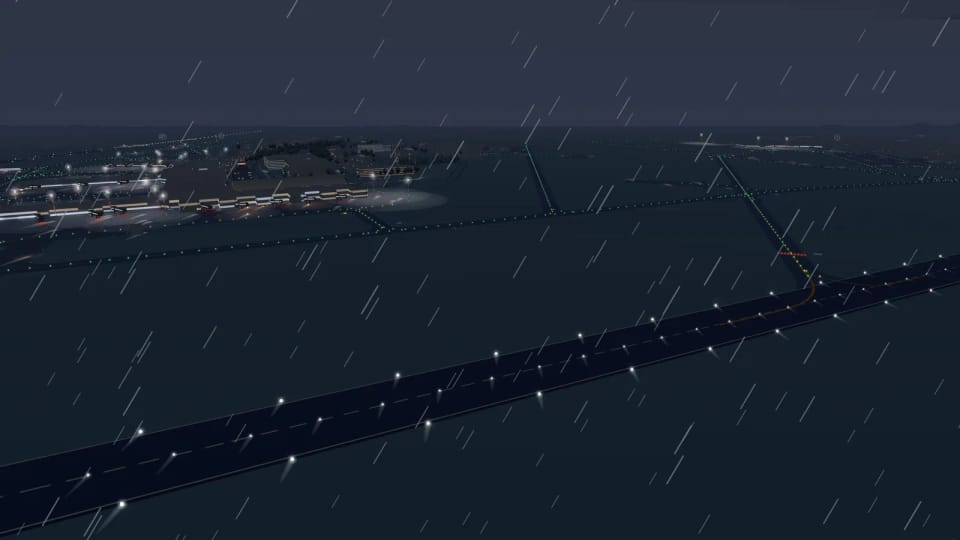
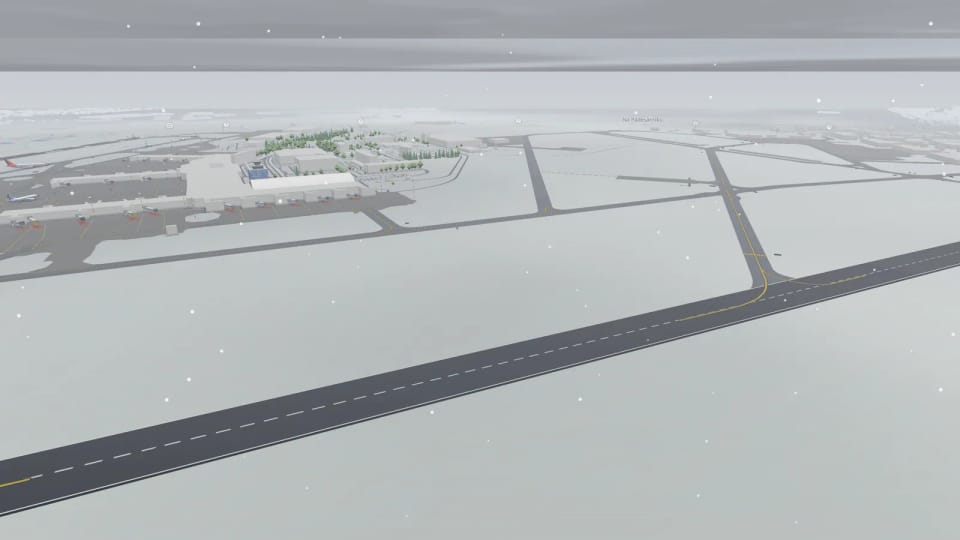
The scene reads the airport’s report every minute, and when the weather changes it fades over, it doesn’t jump. Rain falls as thin streaks leaning with the wind, drizzle finer, snow as slow swaying flakes, hail as small bright pellets. Under snow the grass, the countryside and the roofs turn white, while runways and stands stay dark, because at a real airport someone clears them.
The scene also remembers what has already stopped. After rain the pavement stays dark and shiny for a while, and at night the runway lights, the apron masts and the lights of aircraft on the ground stretch into long reflections on it. If it snowed recently and hasn’t thawed since, the landscape stays white even under a clear sky. We don’t measure snow cover or how wet a runway is, and the scene says so in plain words.
Fog thickens towards the horizon and thins near the camera, and even in thick fog the aircraft and runways stay readable. A storm darkens the light and switches off the sun’s shadows, and at night it glows through the clouds low on the horizon, at most once a second and never as a flash across the whole screen. Accessibility guidelines allow three; we stay at one. Around the airport the real precipitation radar lies on the ground: a measured picture, never a model’s guess.
Play back the past and the weather comes back with it. The scene takes the report that was valid at that minute, including the air pressure the aircraft altitudes are corrected with. If there was no report, it switches to neutral weather and tells you, rather than invent one.
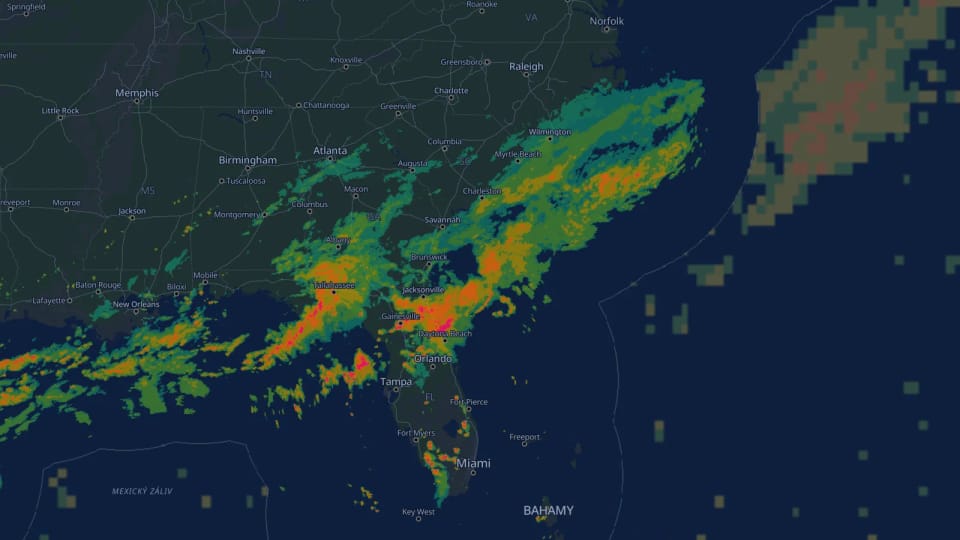
The same radar is on the flat map too, as a layer you switch on. In Europe and the United States it is a real radar picture refreshed every five minutes. Beyond the reach of radars, over the oceans, a forecast model takes over, dimmed and named separately, because a radar measures and a model calculates and the two must never blend into one picture. Radars also see things that aren’t rain, insects or turbulence on a clear evening, so over Europe, where the sky is clear, we leave lone echoes like that out.
From the windsock to two thousand feet
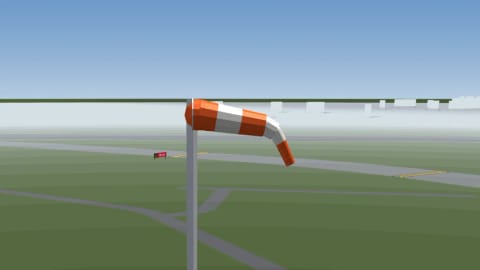
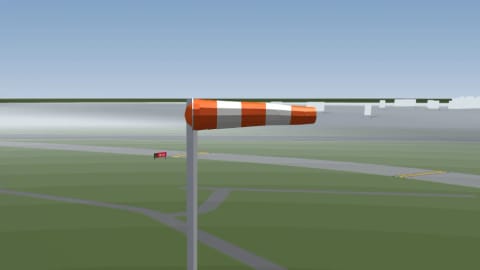
The same report carries the wind, and the windsock by the runway shows it. A pilot reads direction and strength from it at a glance. A real windsock is a cone in five alternating stripes that fills roughly one stripe for every three knots and stands out straight at fifteen.
Ours does the same. It fills from the mouth, the filled front points almost level and the slack rest droops and bends exactly where the filling ends. In gusts it pulses between the average wind and the gust, in variable wind it sways slowly across the reported range, in calm it hangs limp, and at night it is lit. The socks stand where the map records them. Where the map has none, we don’t make one up.
Sometimes the report ends with a short group most readers skip: ‘WS R28L’, wind shear on runway 28L. Wind shear is a sudden change in the direction or strength of the wind over a short distance. At cruising height an aircraft shrugs it off with a bump. On approach it is slow and only a few dozen metres up, and when a headwind turns into a tailwind within seconds, it loses speed and height exactly where it has the least room to spare. Pilots hear about it from the crew ahead of them, from the tower and from systems around some runways, and once it is being reported, the station adds it to the end of the METAR. The TAF forecast can announce it in advance: ‘WS020/21045KT’ means a wind from 210° at 45 knots two thousand feet above the ground.
On every airport’s weather page, on the web and in the app, a card says for which runway shear is being reported, since when without a break and how old the latest report is. A warning fifty minutes old is different information from one that arrived a moment ago. From the forecast we list each period separately with its height and wind, and the height says ‘above ground’ in so many words, because aircraft altitudes on the map are above sea level and in Denver that is a difference of more than one and a half kilometres. A day with shear gets a mark in the calendar. What the report doesn’t carry, the cause or the strength, we don’t guess. And when nothing turns up, the card doesn’t say the air was calm, only that nobody reported shear.
In the thirty days to 5 October, 177 airports reported wind shear in a METAR. Tenerife South led by far, with Taipei, Moscow Domodedovo, Lisbon, Antananarivo and Muscat behind it. 333 airports had it in a forecast, and all but one lie in the United States, Canada, Alaska or Hawaii. The odd one out is the airfield at McMurdo in Antarctica.


An hour with no weather report stays an empty square in the calendar. It doesn’t quietly turn green.