A drone introduces itself
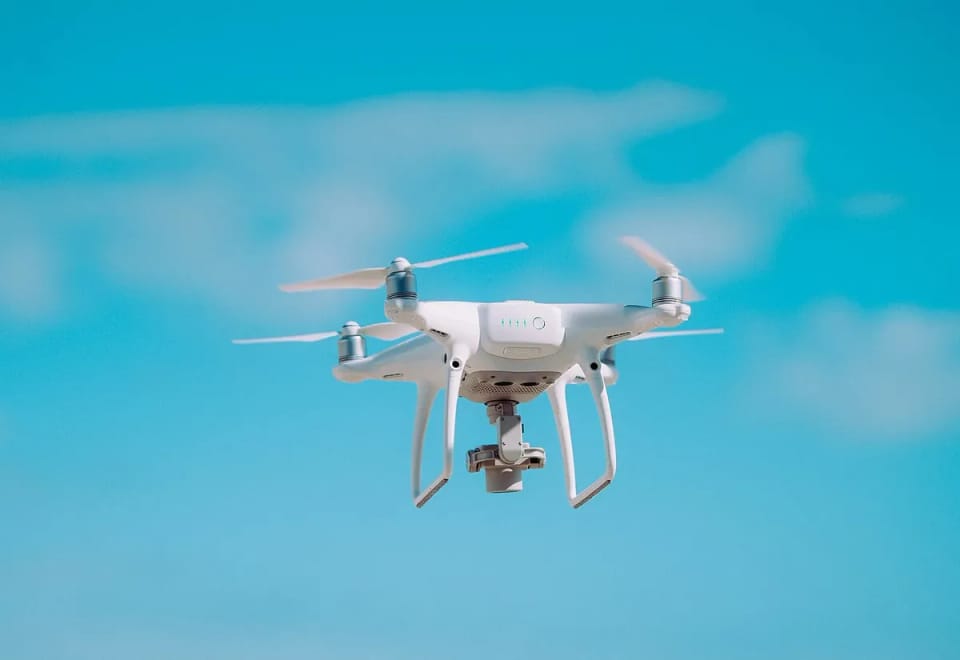
An aircraft on the map has a transponder that says who it is and where it is flying. Drones, for a long time, had nothing of the kind. Since January 2024, though, the European Union has required a drone with a C1 to C3 class label to broadcast its own identity and position while it flies. It is called Remote ID, and in the United States a similar rule has been enforced since March of the same year.
It doesn’t go over any special network. The drone uses Bluetooth or Wi-Fi, the radios everyone carries in their pocket, and roughly once a second it says: this is my serial number, this is my operator’s registration number, here I am, this high, this fast, heading this way. And this is where the pilot is standing, or the spot I took off from.
A phone by the fence hears it, and so does a receiver on the roof. Just not from very far: Bluetooth is not a radio for tens of kilometres. Anyone who wants to see the drones over their village needs an antenna nearby.

There is more than one way to send it, though. The technical standard knows four: older Bluetooth 4, Bluetooth 5 with long range, Wi-Fi beacon and Wi-Fi NAN. The European standard doesn’t accept older Bluetooth as the only path, so a receiver that listens only to that one can miss a drone completely, even one flying right above it. That is why ours can listen on all four.
A small computer by the window
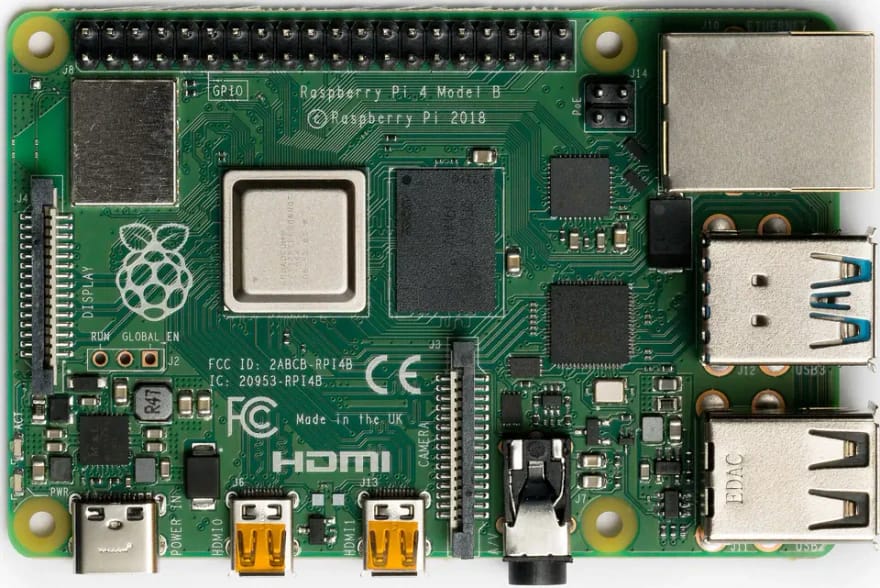
The receiver is a Raspberry Pi, a computer the size of a pack of cards. It has Bluetooth built in. Most drones in Europe, though, broadcast over Wi-Fi or long-range Bluetooth 5, so you add one USB Wi-Fi adapter; without it the station hears only Bluetooth, but it can start straight away and get the adapter later.
We wrote the receiver software ourselves, from the standard, and it installs with a single command. Straight after installing it tells you what your hardware can really do: which Bluetooth version you have, whether it manages long range, which bands the Wi-Fi adapter listens on. Most people don’t know that about their computer, and they don’t have to.
We also thought about things that have nothing to do with drones. The interface the computer uses to reach the internet is never switched over or retuned by the receiver, so nobody cuts off their own connection. If another drone program already runs on the same computer, ours doesn’t fight it for the radio, it listens alongside. And its own logs contain no serial number and no drone position, only counts and times.

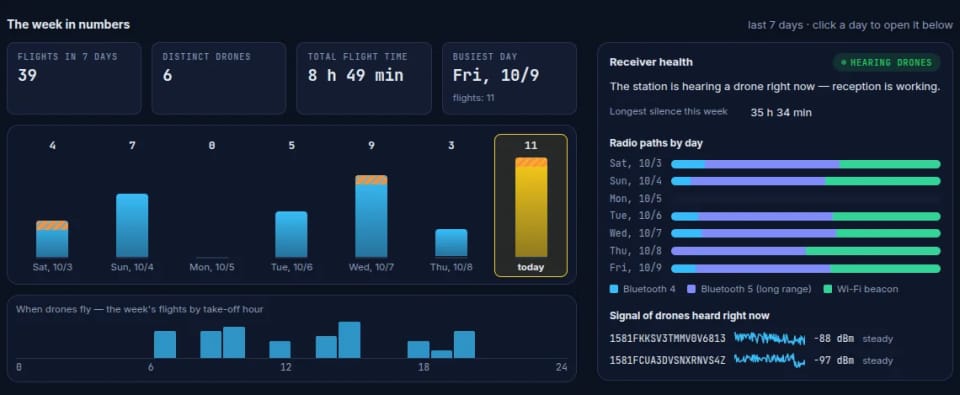
Whether the receiver is listening well is shown on the desk. Receiver health says in words whether the station is hearing drones right now, only listening, or has gone quiet. Silence by itself isn’t a fault, drones don’t fly all the time. So the desk compares today’s silence with how long the gaps between flights usually are during the week, and only when it is unusually long does it say the station has gone quiet. A station that is offline is shown separately, so it isn’t mixed up with nobody flying.
Next to it is the week in numbers: flights per day, the hours when people fly, and how many messages came in over which radio path each day. That is where you see whether the Wi-Fi adapter was worth it.
A desk only you can see
Whatever a station catches, only its owner sees on map.flights. Not other users, not visitors to the map. Nothing about drones goes public: no map, no serial number, no position. The owner sees all of it, because their own receiver decoded it, and only that: when another station hears the same drone, its record never flows into the owner’s view.
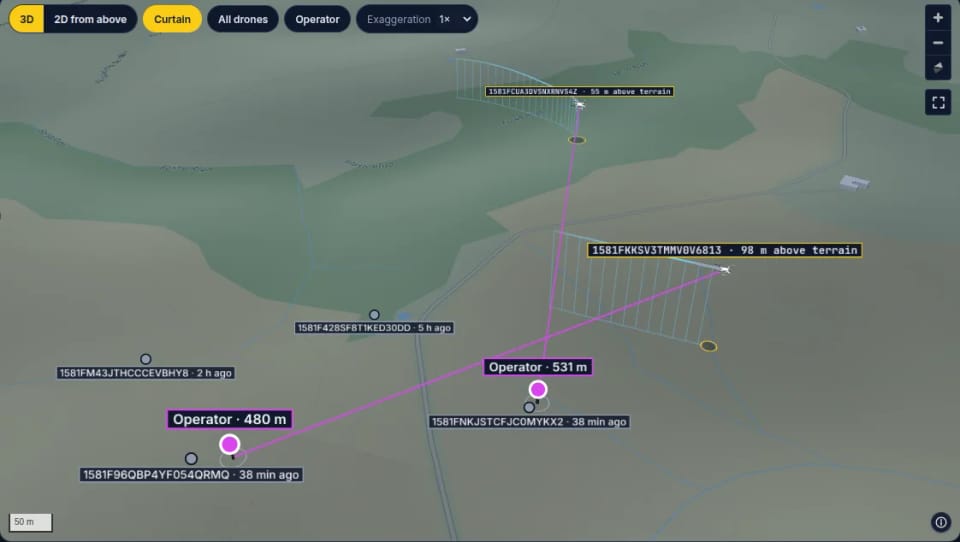
At the top is Right now, a 3D map of the drones the station has heard in the last two minutes. Each hangs at its height on thin lines down to the ground, so you see at once which spot it is over and how high. We draw the pilot as a pin with a ring around it, and a line with the measured distance runs between the pilot and the drone. Drones heard hours ago stay on the map as a dot on their last position, coloured by how long ago it was.
Below that are the day’s flights: how many, how many different drones, the highest and the longest flight, and a timeline on which every drone has a colour of its own. The Play the whole day button runs all of the day’s flights at once in one 3D scene, ten, sixty or three hundred times faster. The silence between flights is skipped, so a whole day over the station goes by in a few minutes, and when two drones flew at the same time, each flies off in its own colour.
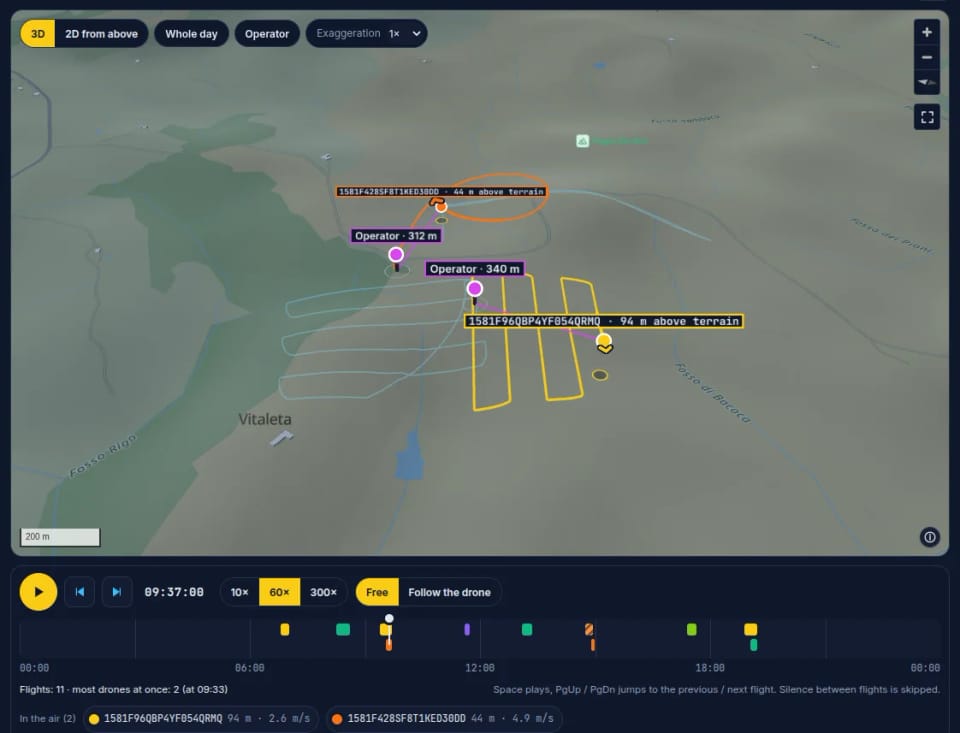
From the serial number we can tell the manufacturer. We don’t guess the model from it: there is no public table with a clear licence that would say so, so next to a drone we only show what it broadcast about itself.
A station can also change hands. The new owner then sees only what it caught from the moment it became theirs; the previous owner’s flights stay hidden. And not every record is a real flight. One that no real drone could manage, its height jumping faster than any multicopter can climb, or circling round and round for longer than a battery lasts, is marked as implausible on the desk and doesn’t count towards the day’s records. Nothing gets deleted.
One flight, taken apart
Click a flight and it opens on a page of its own: the track in 3D with a curtain down to the ground, a player, and the moments of the flight. Take-off, the highest point, the fastest stretch, the spot farthest from the pilot and the end of the recording. Keys 1 to 5 fly the camera straight to them. A paused flight remembers the time in its address, so a saved link opens exactly that second next time.
Under the map is a barogram, the height above terrain over the whole flight, with a dashed line at 120 metres. That is the limit of the open category, the one most drones fly in. It is there for reference only: in another category, or over a tall obstacle, a drone may go higher, and the station can’t tell that from the broadcast. So on our desk the line doesn’t accuse anyone of anything.
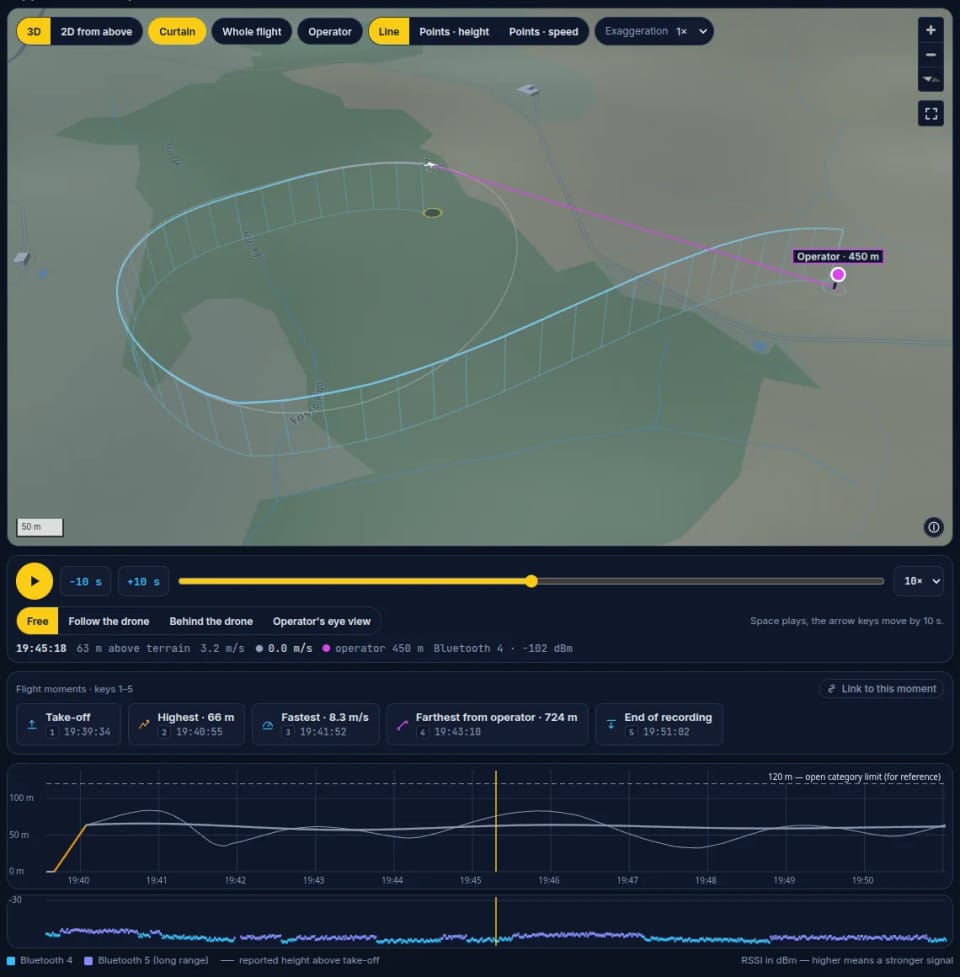
A drone reports more than one height, and none of them is the height above the ground beneath it. The GPS one is measured from a mathematical shape of the Earth, the barometric one shifts with the weather, and the last one the drone counts from the place it took off. Over a hill any of them can be tens of metres off. So we work out the height above terrain from our own elevation model of the landscape, and draw the reported one beside it as a thin line. We never mix them.
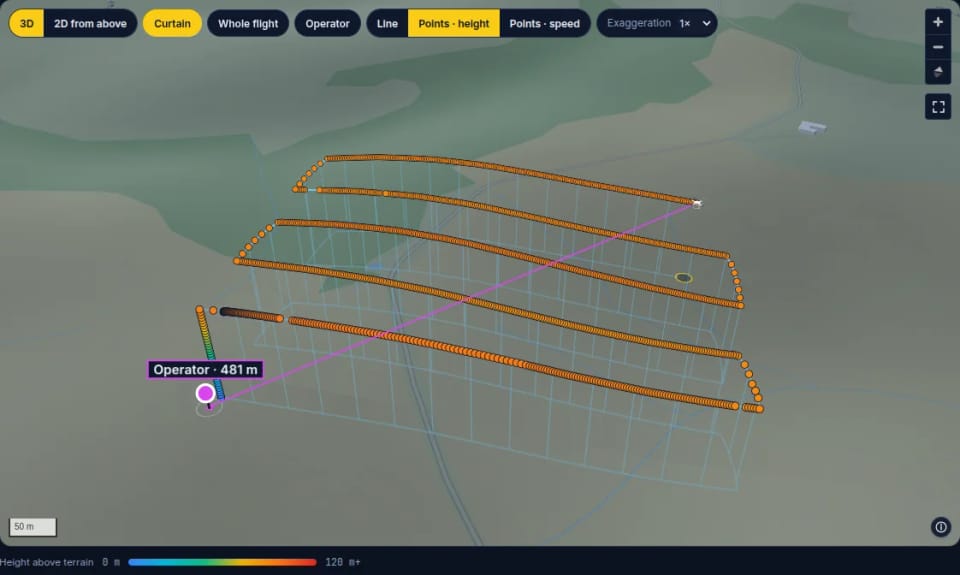
The track can also be shown as the dots of individual messages, coloured by height above terrain or by speed. They show where messages went missing, where the drone hovered in one place and where it sped up. And the camera can follow the drone, fly behind it, or look through the pilot’s eyes, up from where they stood towards the drone.
A whole day over your station goes by in a few minutes: the silence between flights is skipped, and drones that flew at the same time fly off each in its own colour.